Description
This product is available at Prévision Synoptique Cartes prévues – Misva (aeris-data.fr) ( Parameter=Vel-Pot) and shows the anomalies of daily Velocity Potential at 200 hPa and the divergent wind vector at 200 Pa (Top).
The lower map shows the intraseasonal anomaly (coloured range) and the contribution of the various waves in contours (bottom). Only anomalies favourable to convection are plotted (solid line), with the exception of the MJO, for which unfavourable phases are also plotted (dashed line).
Each contour colour corresponds to a given wave according to the intervals given at the bottom of the figure: 1 contour=2 m2s-1, 2 contours = 3 m2s-1 etc. The filtering domains are provided in the methodology section.

This figure can be combined with filtered hovmöllers showing the propagation of equatorial waves (see Additional products below).
Methodology
The contributions of each wave are estimated by filtering the observation and model data in space (wave number) and time (frequency) using the method of Wheeler and Kiladis (1999) and Wheeler and Handon (2004).
A time series of 360 days of observations followed by 10 days of forecasts (in the case of the deterministic model) is constructed for each point of latitude and longitude and then completed by 180 days containing the climatology. The intraseasonal anomaly is constructed by subtracting an annual daily climatological cycle in which only the first 3 harmonics are retained (T> 120 days).
A Fourier transform is performed in time and space on the intraseasonal anomaly to project the parameter into wavenumber-frequency space. During the filtering process for a given wave, the parameter values are set to zero for all wavenumbers and frequencies except in the value intervals where this wave is defined.
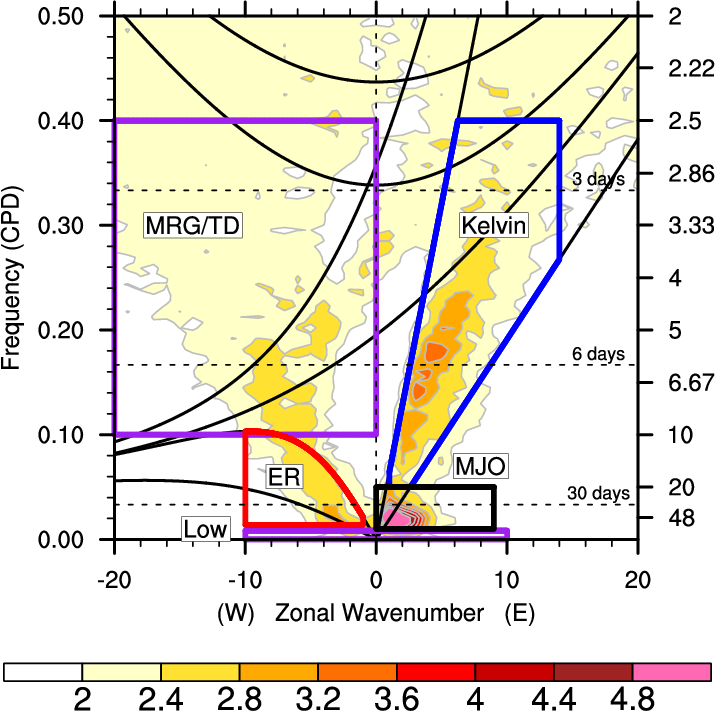
The filtering domains are shown below for each wave with the spectrum of the OLR spectral density (i.e. the variance of the OLR obtained for each frequency-wavenumber). The periods (T) and wavenumbers (k) considered for each wave are also indicated.
- Purple : low frequency
- T > 120 days, – 10 < k < 10
- Black : Maden-Julian Oscillation (MJO)
- 30 days < T < 96 days, 0 < k < 9
- Red : Onde de Rossby équatoriale (ER)
- : 9,7 days < T < 72 days , -10 < k < -1
- Bleu : Onde de Kelvin (K)
- 2,5 days < T < 17 days, 1< k < 14
- Green : Tropical Depression and Mixed Rossby Wave – TD/MRG
- 2.5 days < T < 10 days , -20 < k < -6
Use
Velocity Potential (VP)
Deep convection generates upward motions in the upper troposphere, with divergence at the 200 hPa level. Altitude divergence is therefore a good marker of convective activity from a dynamic point of view, but its spatial distribution is very noisy. The velocity potential makes it possible to smooth out these fine-scale structures and retain only the strongest signals at large scale.
The velocity potential thus behaves like a smoothed wind convergence field. In practical terms, negative values of the velocity potential at 200 hPa (coloured blue/green on this product) correspond to altitude divergence and make it possible to track the movement of zones favourable to convection.
Filtered anomaly map
The product described here for the velocity potential can be used to track waves marked by altitude divergence, such as Kelvin waves, the MJO and possibly the low-frequency part when it is present. It can be used to track the activity of all the waves and in particular to target wave crossings, a situation where the contours of a Kelvin (blue) or MJO (black) wave cross those of an equatorial Rossby wave (red). The maps below show the main waves and a wave crossing at the end of the season.
Equatorial wave tracking:
- The low frequency (purple) is not very active, mainly centred on the maritime continent (90-180E).
- There is also an active MJO phase (solid black line) moving slowly over the Tropical Atlantic/Gulf of Guinea zone. In this example, the MJO is being overtaken by the Kelvin wave.
- We can clearly see the arrival of a Kelvin wave (blue) near the equator over South America on 28/10, moving eastwards to arrive over West Africa on 30/10.
- An equatorial Rossby wave (red) was well marked at 0°E on 28/10 and moved westwards to “cross” the Kelvin wave and the MJO on 30/10.
- The result is a reinforced negative velocity potential anomaly (blue/green colour), i.e. altitude divergence, favouring intense rainfall.

Associated rainfall: The IMERG rainfall (mm) corresponding to the situation at wave crossing on 30/10 is shown. Maximum rainfall is visible over the coast of Sierra Leone, Liberia and off the coast. The MJO trace is also visible in rain over central and equatorial Africa.

Additional products :
Other parameters
Pour les ondes marquées en tourbillon (MRG, Eq. Rossby, ondes d’est Africaines), le paramètre potentiel de vitesse n’est adapté que pour les ondes très intenses. Il est utile de compléter l’analyse par le même produit pour la fonction de courant, le vent méridien où l’eau précipitable, accessible sur ici en choisissant (Parameter = PW, Stream-Fct, Domain=Global).
Hovmöller of filtered waves
The analysis of equatorial wave maps needs to be completed using hovmöllers to track wave propagation. The hovmöller corresponding to the previous situation is shown below. Between 28 and 31 October 2021 we find a situation where the velocity potential anomaly is favourable (blue/green colours towards 20°W). The contours show the propagation of the Kelvin/MJO waves (blue/black) which cross the equatorial Rossby wave (red).
These hovmöllers are available at Prévision Synoptique Hovmollers – Misva (aeris-data.fr) with the selection : Domain = Global ; Parameter = PW-VelPot-Stream-Fct. and different choices of latitude bands.
