Contribution by the low frequency
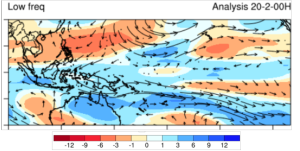
Anomalous subsidence in the upper layers is extending from the South China Sea to the Northwest Pacific Ocean. Good agreement among two filtering products (Fig.S3-1). At 850hPa, anomalous divergence covers all the MC.

Figure 2 shows a combination of PW and 850 wind anomaly. A dry, easterly anomaly extends from the Philippines to southern Vietnam and southern Thailand. A moist anomaly covers most of Indonesia and Papua-New-Guinea (Fig.22), with a westerly anomaly from the Java Sea to PNG, which contributes to stronger than normal monsoonal winds.


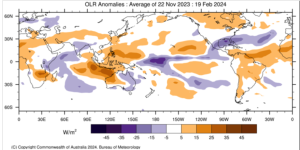
In OLR, the passed 90 days total anomaly follows the El Nino response, plus a remnant of +IOD (Fig.3). The observed trend is a weakening positive anomaly over the MC, and a negative anomaly extending above northeastern PNG.
Contribution by the Madden-Julian Oscillation
Although the MJO looks indiscernible on the RMM index (Fig. 4 left ), VP200 suggests a more coherent, MJO signal (Fig. 4 right ). Here is an extract from the NOAA/CPC MJO update of 19 Feb “RMM observations show a westward retreat of the MJO signal over the Western Pacific earlier this month, but the MJO has since resumed its eastward propagation and has moved into phase 8 (Western Hemisphere) in RMM space. Consistent with model guidance since last week, a much weakened MJO is generally favored in the RMM forecasts, with model solutions showing the signal mostly remaining within the unit circle during the next two weeks. However, there is some question as to whether this weakening is reflective of a disorganizing MJO or the removal of the 120-day mean which is strongly skewing the MJO signal to the right in RMM space. Upper-level velocity potential anomaly and OLR forecasts suggest the latter, which depict a more coherent MJO moving forward”

Note that the signal in U850hPa on subseasonal filtering products is weak but present (not shown). The Day 9 prediction of the deterministic ecmwf (Fig. 5) clearly shows the westerly phase stretching from Equatorial Africa to the Maldives, while the MC is under the influence of the easterly phase The signal in PW is unclear.
Conclusion: MJO favoring subsidence on Week 1 over the eastern MC. Then, the divergent phase of the MJO could reach the MC on Week 3, associated with westerly 850hPa wind anomalies.

Contribution from Equatorial Rossby Waves
A contribution by an ER wave to upper divergence (VP200) is expected to extend from the southern Philippines to central MC by the end of Week 2.
At 850 (Fig. 6) and 700hPa, ER will contribute to a westerly anomaly with a pair of symmetric vortices late Week 1 over East MC, with continued contribution to vorticity within the Australian Monsoon Trough on Week 2. In PW, the westerly anomaly is associated to excess of moisture (not shown) from Java to Timor on Week 2.

Figure 6: Top: Predicted contribution from the ER wave to 850hPa wind at day 4 , end Week 1. Bottom: same as Top , except for 850 hPa wind and streamfunction at day 9, Week 2
Contribution from Kelvin waves
A contribution by a rather weak Kelvin wave to upper divergence (VP200) is expected to reach western MC late Week 1, then cross the ER wave over Eastern MC on Week 2. The westerly anomaly on late Week 1 is associated with a moist contribution and even some positive vorticity south of Java. It will be followed by a marked easterly anomaly on Week 2 (Fig. 7)

Figure 7 : Predicted 850hPa wind and precipitable water anomalies at day +4, late Week 1
Contribution by Mixed Rossby Gravity waves
After TC Lincoln have evacuated, a MRG wave train centred over the meteorological equator will modulate the vorticity within the Australian monsoon trough, with additional vorticity at the longitude of Darwin by the end of Week 1 (Fig. 8).

Contribution by the sum of the waves
The sum of anomalies provided by the MJO and all waves explains most of the pattern seen in the total anomaly field, both in wind and precipitable water. The only significant difference is that the total anomaly is moist over Borneo and Sulawesi, while the sum of the waves is slightly dry (Fig. 9).

Summary – Link with traditional charts
subseasonal range
The low frequency brings a well marked cross-equatorial flow across Sulawesi and Moluccas islands, and strong monsoonal westerlies over Timor and Arafura seas.
The ECMWF weekly rainfall anomaly (also seen on tercile charts) shows a maximum on Week 3, followed by a decreasing probability on Week 4 (Fig. 10). Note that this kind of weekly anomaly charts from Monday to Sunday may miss the main signal if the anomaly peaks between two weeks. This is especially true for Week 1 and Week 2, where models are able to give a more detailed chronology of the anomalies.

Week 1 and Week 2
On 850hPa streamlines and 24h rainfall (shading) probabilistic charts based on the ecmwf EPS ensemble (Fig.S3-11), the forecaster can track two main active areas which coincide with confluent westerlies: one moving east (blue circle), one moving west very slowly (red circle). They are predicted to merge early Week 2 and eventually evacuate eastwards, followed by a dry period again over most of the MC by the end of Week 2. The westward moving pattern in the red circle is easily recognizable with its symmetric pair of cyclonic gyres: it is the ER wave detected on Fig.S3-6. The pattern in the blue circle looks like the Kelvin wave detected on Fig.S3-7.
So, we expect a peak of rain on Sunday 25 February over offshore islands and regions bordering the Java, Flores and Banda Seas. Figure 13 shows the ecmwf probabilistic meteogram for Makassar, South Sulawesi, which has a pure monsoonal climate: the peak on Sunday is followed by a dry period linked to the dry, easterly phase of the Kelvin wave seen over the Indian ocean on Figure 7.


Figure 13: Ecmwf EPSgram for Makassar gridpoint.
Assessing the risk of extremes
The ecmwf Extreme Forecast Index (Fig.S3-13) predicts around the Flores Sea between Sulawesi and Timor island a high probability of above median 24h rainfall at day 7, Sunday 25 February, with a possibility of extremes (the quantile 99 is 30-50mm per day in the model climate)

Assessing the risk of Tropical Cyclone
On Week 2, although the MJO is expected over the Indian ocean, extended ecmwf predicts above climate average vorticity (Fig. 14). Note that the term TC refers here to the low threshold 8 m/s, i.e cyclonic circulation. This chart can be interpreted as the vorticity within the monsoon trough. Still in the ecmwf, the anomaly of storm strength remains not significantly different from climate risk.
Note that the NOAA/CPC weekly tropical outlook bulletin refers to the role of Rossby or Kelvin wave: “Interestingly, Indian Ocean MJO (phases 2 and 3) events historically lead to decreased chances for TC formation near Australia and the Maritime Continent but guidance from both the GEFS and ECMWF suggest a higher chance for TC genesis during the forecast period across the northern Australian coast than might otherwise be indicated, possibly due to Rossby or Kelvin wave interference.

